Particle size distribution analysis plays a pivotal role across various industries, from agriculture to pharmaceuticals. In this comprehensive blog post, we’ll delve into diverse particle size distribution analysis methods, with a particular focus on laboratory sieve analysis and the indispensable laboratory sieve set. Furthermore, we’ll provide a grain size distribution chart to enhance your understanding.
Understanding Particle Size Distribution:
Particle size distribution (PSD) is the way particles of varying sizes distribute within a material. It is of utmost importance because it significantly influences material properties and performance across various applications. PSD analysis empowers scientists and engineers to determine size ranges and quantify particles within a sample.
Methods for Particle Size Distribution Analysis:
- Sedimentation Method:
- Principle: Particles settle in a liquid medium based on size and density.
- Equipment: Employ sedimentation analyzers, such as the hydrometer method or the pipette method.
- Applications: Widely applied in soil science, sedimentology, and the analysis of fine-grained materials.
- Laser Diffraction:
- Principle: Laser beams scatter off particles, and the angle of scattering provides information about particle size.
- Equipment: Utilize laser diffraction particle analyzers.
- Applications: Suitable for a wide range of materials, including powders, emulsions, and suspensions.
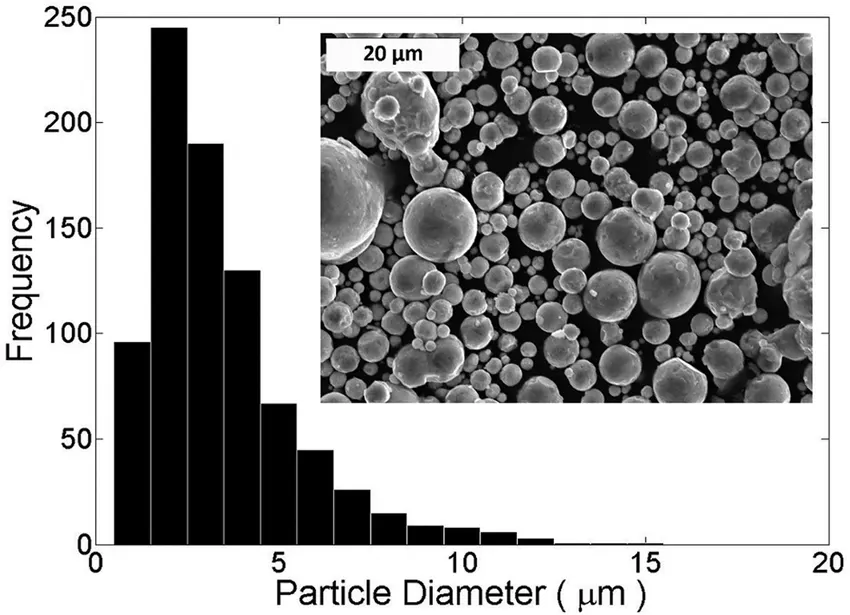
- Electron Microscopy:
- Principle: High-resolution electron microscopes directly visualize and measure individual particles.
- Equipment: Utilize scanning electron microscopes (SEM) or transmission electron microscopes (TEM).
- Applications: Essential for nanoscale particle analysis and research.
- Dynamic Light Scattering (DLS):
- Principle: Measures the Brownian motion of particles in a solution to determine their size.
- Equipment: Deploy dynamic light scattering instruments.
- Applications: Ideal for analyzing colloidal and nanoscale particles.
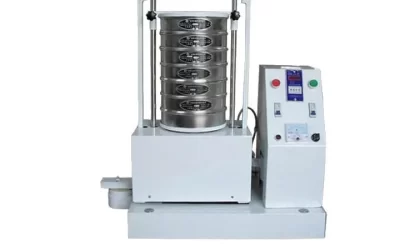
Laboratory Sieve Analysis:
Laboratory sieve analysis stands as a widely used and versatile method for particle size distribution analysis. It involves passing a sample through a series of sieves with progressively smaller openings. The sieves are stacked in order of decreasing aperture size, and particles that cannot pass through a particular sieve are retained. We then weigh the retained material on each sieve and use the cumulative data to create a grain size distribution chart.
The Components of a Laboratory Sieve Set:
A laboratory sieve set comprises several essential components:
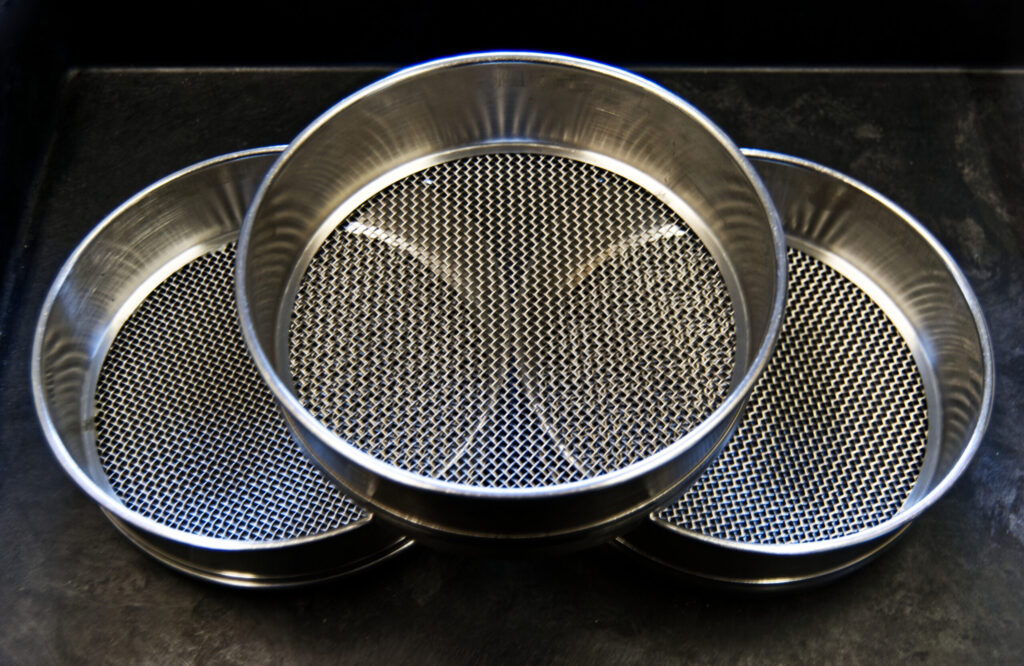
- Sieve Frames: These frames are typically made of brass or stainless steel and hold the sieve mesh.
- Sieve Mesh: The mesh is a woven wire or perforated sheet with specific openings (measured in microns or millimeters) that allow particles of a certain size to pass through.
- Lid and Receiver: These components collect and hold the particles that pass through the sieves. The receiver is typically placed under the sieves, and the lid keeps the particles contained.
Grain Size Distribution Chart:
A grain size distribution chart is a graphical representation of the results obtained from a laboratory sieve analysis. It displays the percentage of material retained on each sieve against the sieve size (in microns or millimeters). This chart provides a visual overview of the particle size distribution within the sample.
In conclusion, comprehending particle size distribution analysis methods is pivotal across industries, from construction to pharmaceuticals. Laboratory sieve analysis, facilitated by a well-equipped laboratory sieve set, remains a practical and effective method for numerous applications. When conducting particle size distribution analysis, selecting the appropriate method and tools is key to obtaining accurate and meaningful results for material characterization and quality control.